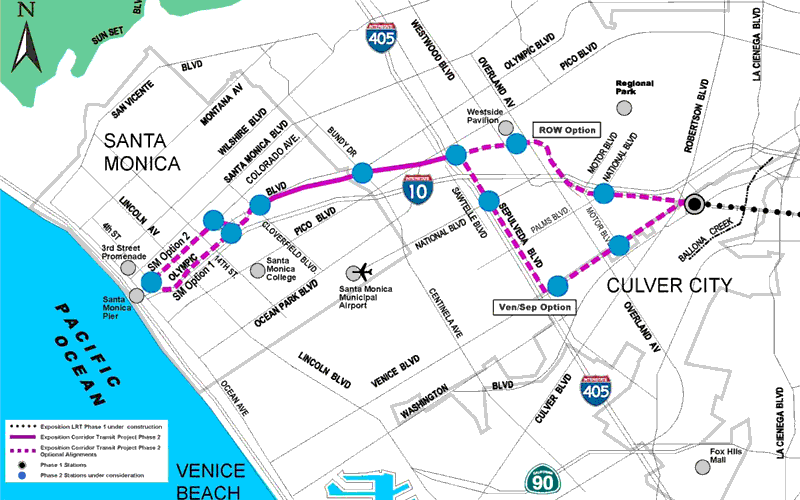
Phase 2 Draft EIR key points

Friends4Expo Transit has endorsed the Expo Line phase 2 route that uses the existing railroad right-of-way, based on documentation by the Draft Environmental Impact Report (DEIR) that it is faster, much less expensive, has greater ridership, and has fewer environmental impacts.
We also support the City of Santa Monica's request for the at-grade alignment along Colorado.
The right-of-way route, compared with the Venice-Sepulveda route, has:
- Greater ridership and is 4-6* minutes faster (*note the DEIR counts worst-case intersection delays for gated crossings that overstate likely travel time and understate projected ridership)
- Less than 2/3 the cost — $460 million less expensive (2008$)
- Less than 1/3 the property takes and far fewer residential displacements
- Neither the traffic (2 intersections) nor visual (aerial structures) Significant Unavoidable impacts, although it does change the visual character of the right-of-way west of Overland.
See our Right-of-Way, Venice-Sepulveda, and West LA-Santa Monica pages for more details, and Light Rail for Cheviot for considerations of at-grade vs. elevated crossings and parking lot vs. greenway at the Westwood station.
The DEIR concludes:
7.5 Summary
LRT 1 (Expo ROW–Olympic Alternative) and LRT 2 (Expo ROW–Colorado Alternative) have an advantage over LRT 3 (Venice/Sepulveda–Olympic Alternative) and LRT 4 (Venice/Sepulveda–Colorado Alternative) in terms of basic environmental compatibility, performance, and conformance with the goals of the Project. In addition, LRT 1 and LRT 2 perform significantly better from a cost-effectiveness perspective. (Page 7-11)
| Performance Summary | LRT 1 — Expo ROW-Olympic | LRT 2 — Expo ROW-Colorado | LRT 3 — Venice-Sepulveda-Olympic | LRT 4 — Venice-Sepulveda-Colorado |
| 2030 Weekday Boardings (Phase 2 Only) (Tables 1, 2.5-1) |
36,653 | 36,412 | 35,880 | 35,849 |
| 2030 Weekday Boardings (Phases 1 and 2 Combined) (Table 1) |
64,048 | 63,998 | 62,105 | 62,077 |
| Estimated Travel Time Culver City-Santa Monica (worst-case minutes) (page 2-36) | 18.2 | 19.5 | 22.1 | 23.4 |
| Likely Travel Time (omitting excess delay time counted) |
14 | 15 | 20 | 21 |
| LRT Alternatives Capital Costs in 2008$ (000s) (Table 4, 6.2-2) | $969,909 | $932,423 | $1,434,786 | $1,390,811 |
| Cost per Annual Hour of User Benefit (Tables 7, 7.3-1) | $20.21 | $20.01 | $32.76 |
$32.23 |
| Significant Unavoidable Environmental Impacts | ||||
| Transportation/Traffic (Table 8) | Sepulveda-Palms; Girard-Midvale-Venice |
Sepulveda-Palms; Girard-Midvale-Venice |
||
| Aesthetics (Tables 8, 3-3.2) | Loss of Olympic Blvd. coral trees; Westwood station | Westwood station | Olympic Blvd. coral trees; 8,400 feet of elevated guideway | 8,400 feet of elevated guideway |
| Socioeconomics — Displacements | ||||
| Property Acquisitions — full/partial (Table 3.16-3, not including curb cuts) |
13/15 | 13/18 | 44/74 | 44/77 |
| Residential Displacements (Table 3.16-4) | 2 units 5 residents |
1 unit 3 residents |
105 units 256 residents |
104 units 254 residents |